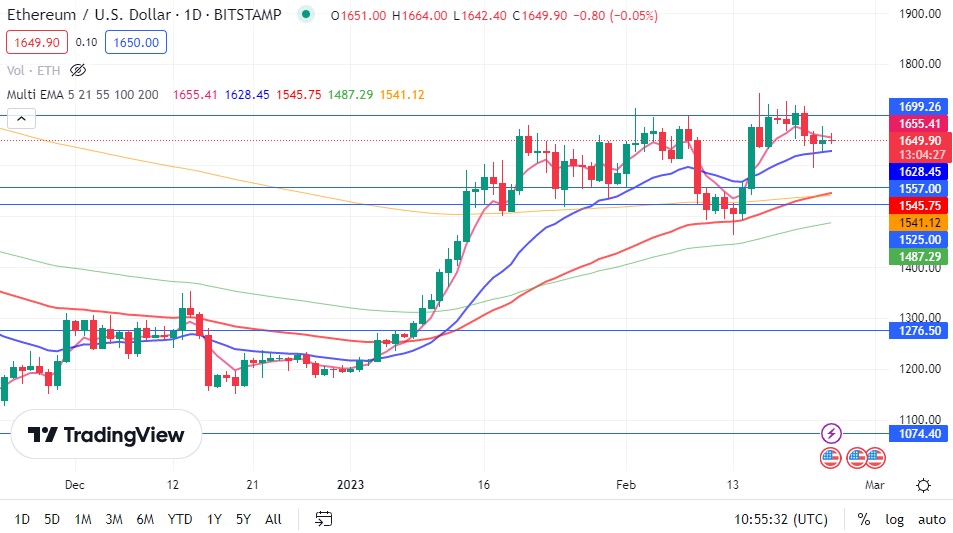
Ethereum is in second place behind the leading cryptocurrency Bitcoin and continues to squeeze. Unable to break the $1700 resistance, Ethereum continues to retreat with sales from this region. Ethereum, which has been selling for four days, is stuck between the averages of Ethereum, which is traded between the $ 1600-1700 level (EMA5-EMA21). Starting at $ 1643 yesterday, Ethereum closed the day at $ 1650 with an increase of 0.44, with sales after seeing the highest level of $ 1678.
Ethereum, which started at the $ 1651 level, is trading at $ 1649 with a decrease of 0.05% at the time of writing.
Ethereum Chart Analysis
Ethereum, which could not close above the resistance at the $ 1700 level, continues to retreat with intense sales in this region. When we examine the Ethereum chart, I see that the price is stuck between EMA5 and EMA21. Accordingly, the EMA5 value of $ 1655 and $ 1700 can be followed as resistance points. In case of possible pullbacks, the EMA21 value of $1628 and the horizontal support of $1557 can observe as daily support points.
This article does not contain investment advise or recommendations. Every investment and trading move involves risk, and readers should conduct their own research when deciding.
You might check: STEPN: The Social Network That Lets You Monetize Your Skills


